Crédit Agricole Consumer Finance (CACF) wanted to re-design their website to be able to contact clients looking for a leasing car quicker. I worked for 6 months on this project with a UI designer.
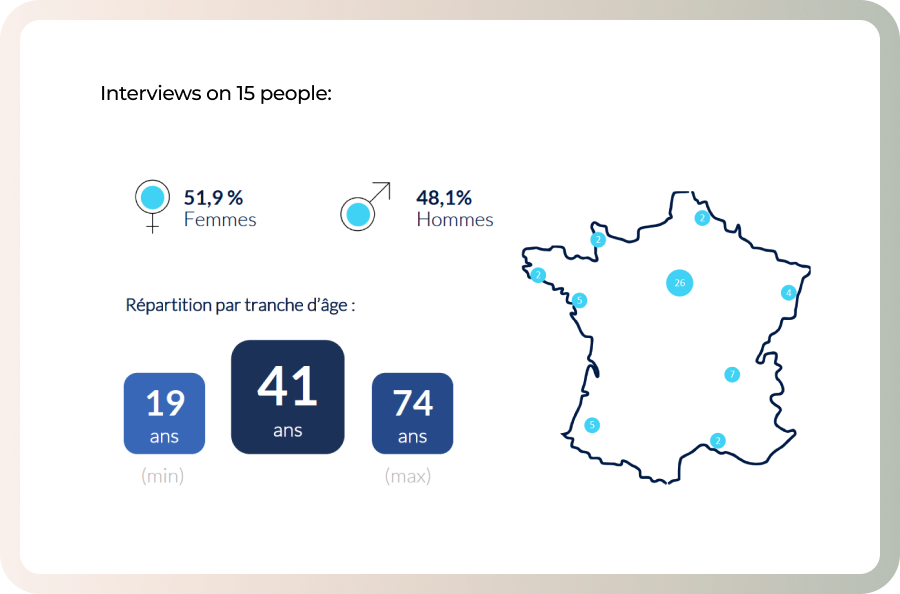
To increase qualified leads number, we first need to know who are our target users. We started with 2 focus groups composed by 14 people, studied reasons why they subscribed to a leasing contract, their motivations and their fears. Then we confronted them with people who do not use this type of service.
We made a survey on 120 persons to confirm the trends observed during the focus groups, to confirm the advantages and perceived obstacles about the leasing, and also to identify our key users.
Leasing a new car
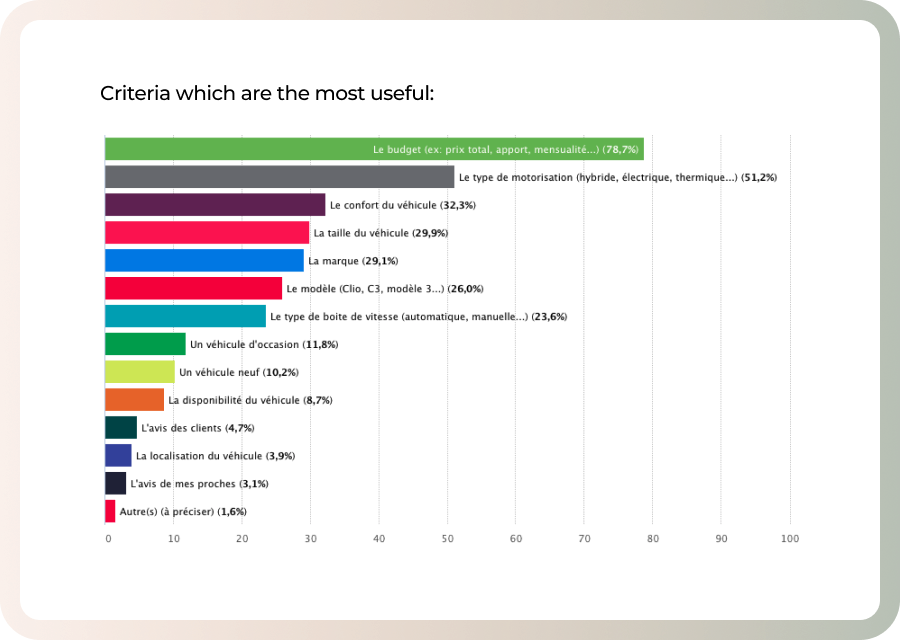
Based on the focus groups and survey, we learnt what people were interested in when looking for a new car. For example, the budget and the motorization were the two main criteria people found useful when they need a new vehicle.
People need to be reassured
80% respondents to the survey knew what kind of car they wanted before they went on the Internet. But they were not ready to sign. We identified few points where we needed to provide information or services for the users: Where to try the vehicle? How much can they sell their old car? What happens at the end of the contract, etc.
Why would you choose a Leasing car? Why not?
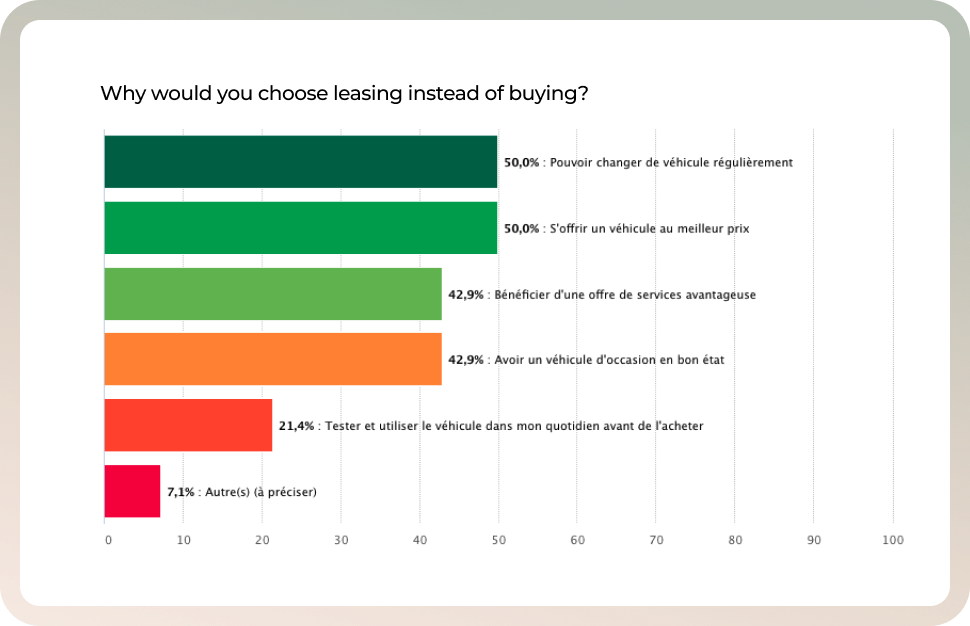
We quantified arguments why people are interesting in leasing a car instead of buying a new one, but also why are they reluctant to sign a leasing contract. Those arguments will help us with the wording on the new website.
Key data
80
%
Knew what kind of car they wanted
50
%
Prefer leasing to be able to change their car often
78
%
Budget first
Persona
Target users
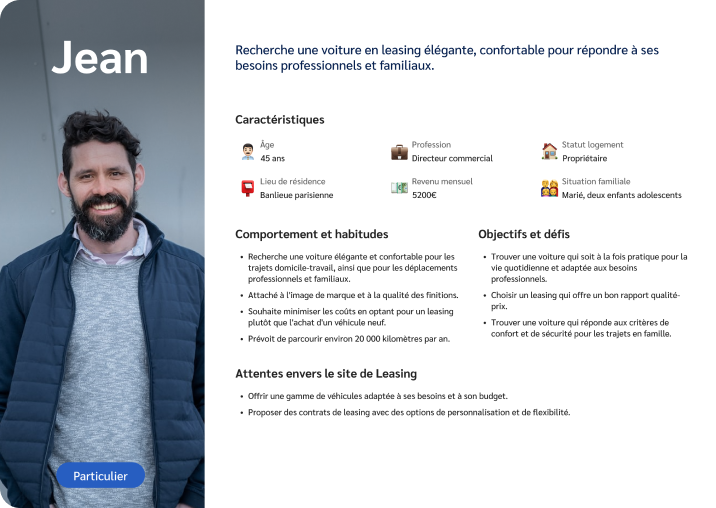
Target criteria based on 134 persons (from the focus-group and the survey) and knowledge from the business team:
Jean is our main persona to tackle the new website: •42-45 years old on average • 68% have a salary between 3 000€ and 5 999€ • Executives and engineers corporate, Private Sector Employees, Liberal and freelancer professionals. • Homeowner
02
Benchmark
What are people looking for online? 👀
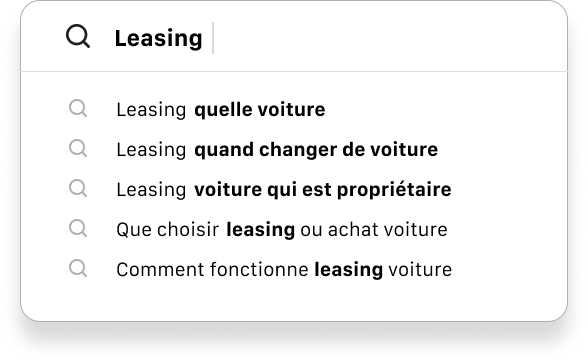
We looked at an analyze search engine autocomplete data, and identified questions associated with “leasing car”. It helped us to promote some articles and to use relevant wording on the new website.
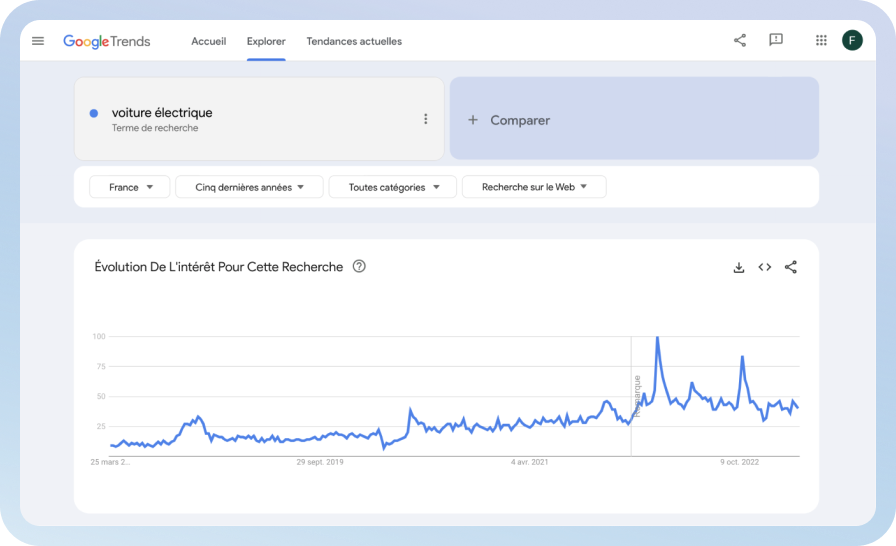
Thanks to GoogleTrends, we also noticed people looking for electric cars were growing. So we took that point to get electric car on our navigation for a better SEO and also to promote electric cars on the catalog with specific blocs and articles.
What is the competition doing?
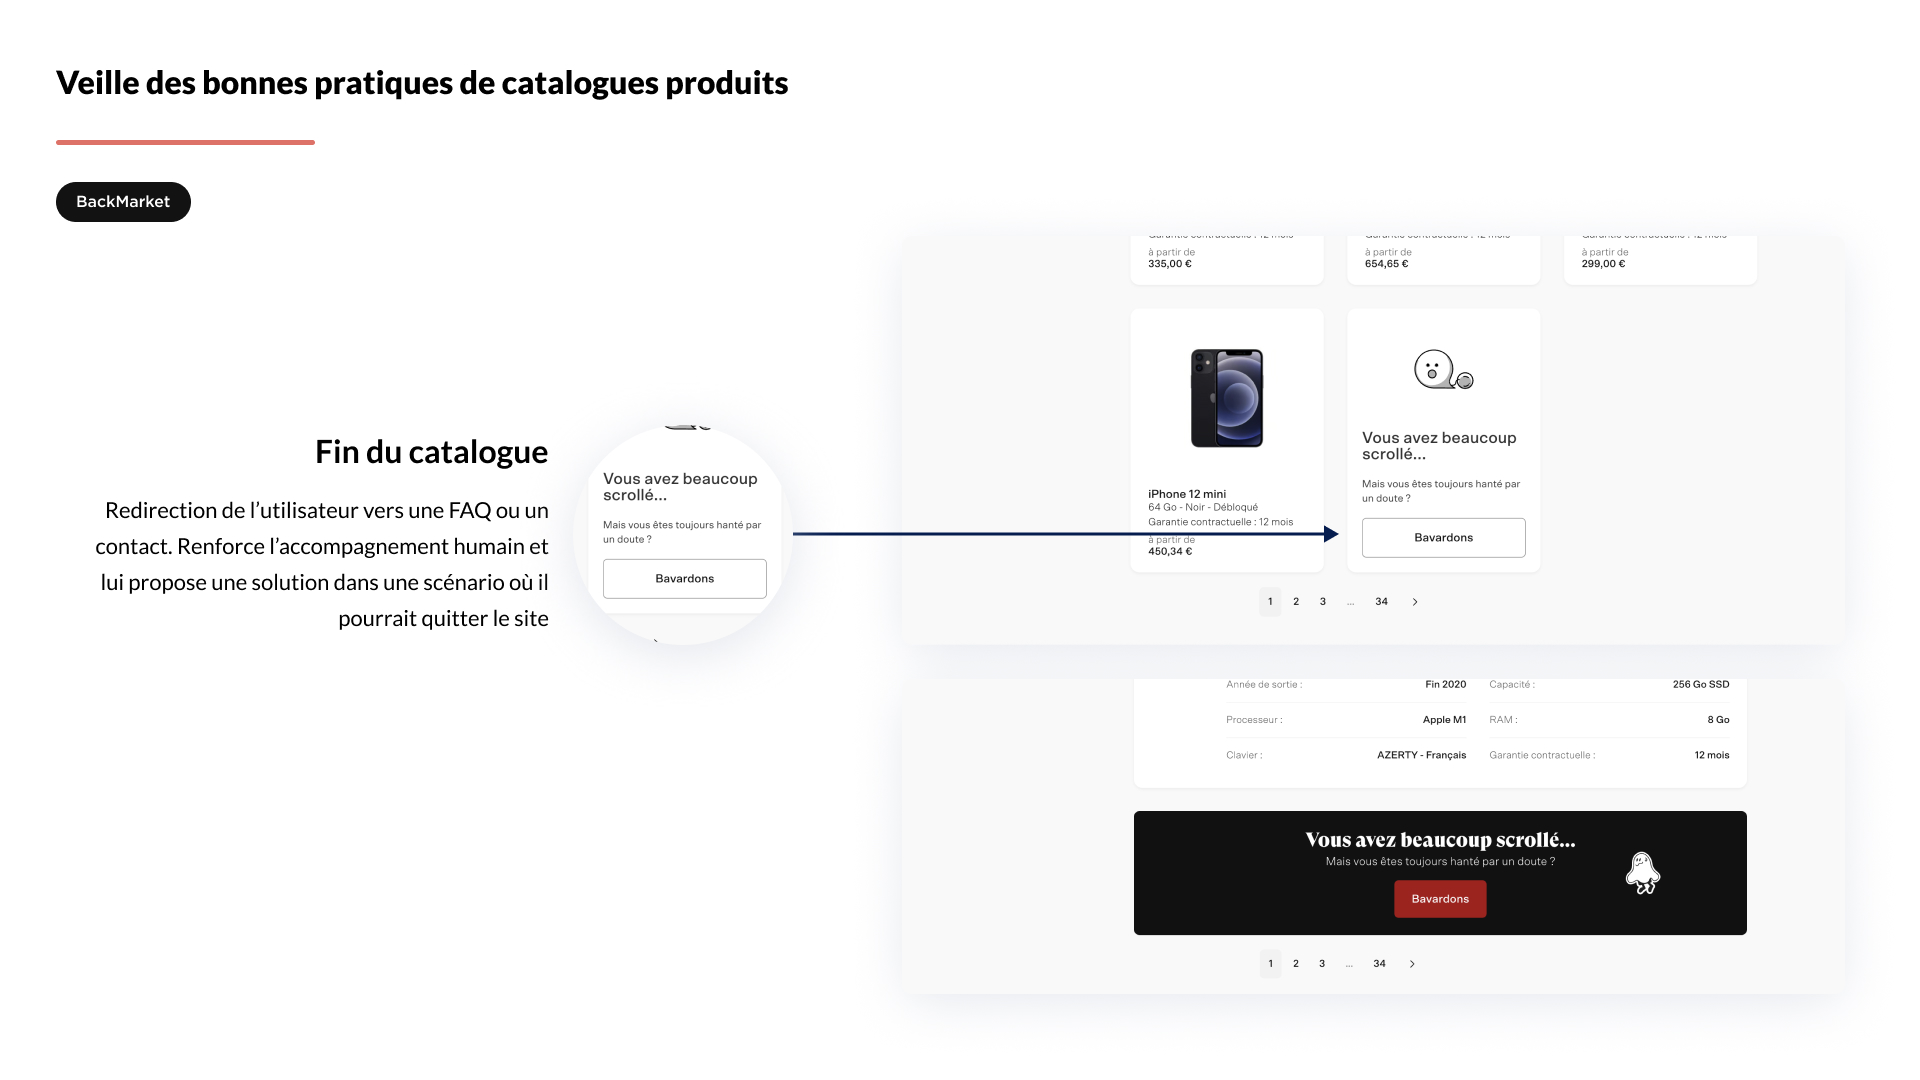
Since the catalog page was the first priority to develop, we did a benchmark of the trends. I looked at direct and indirect competition.
03
Interfaces
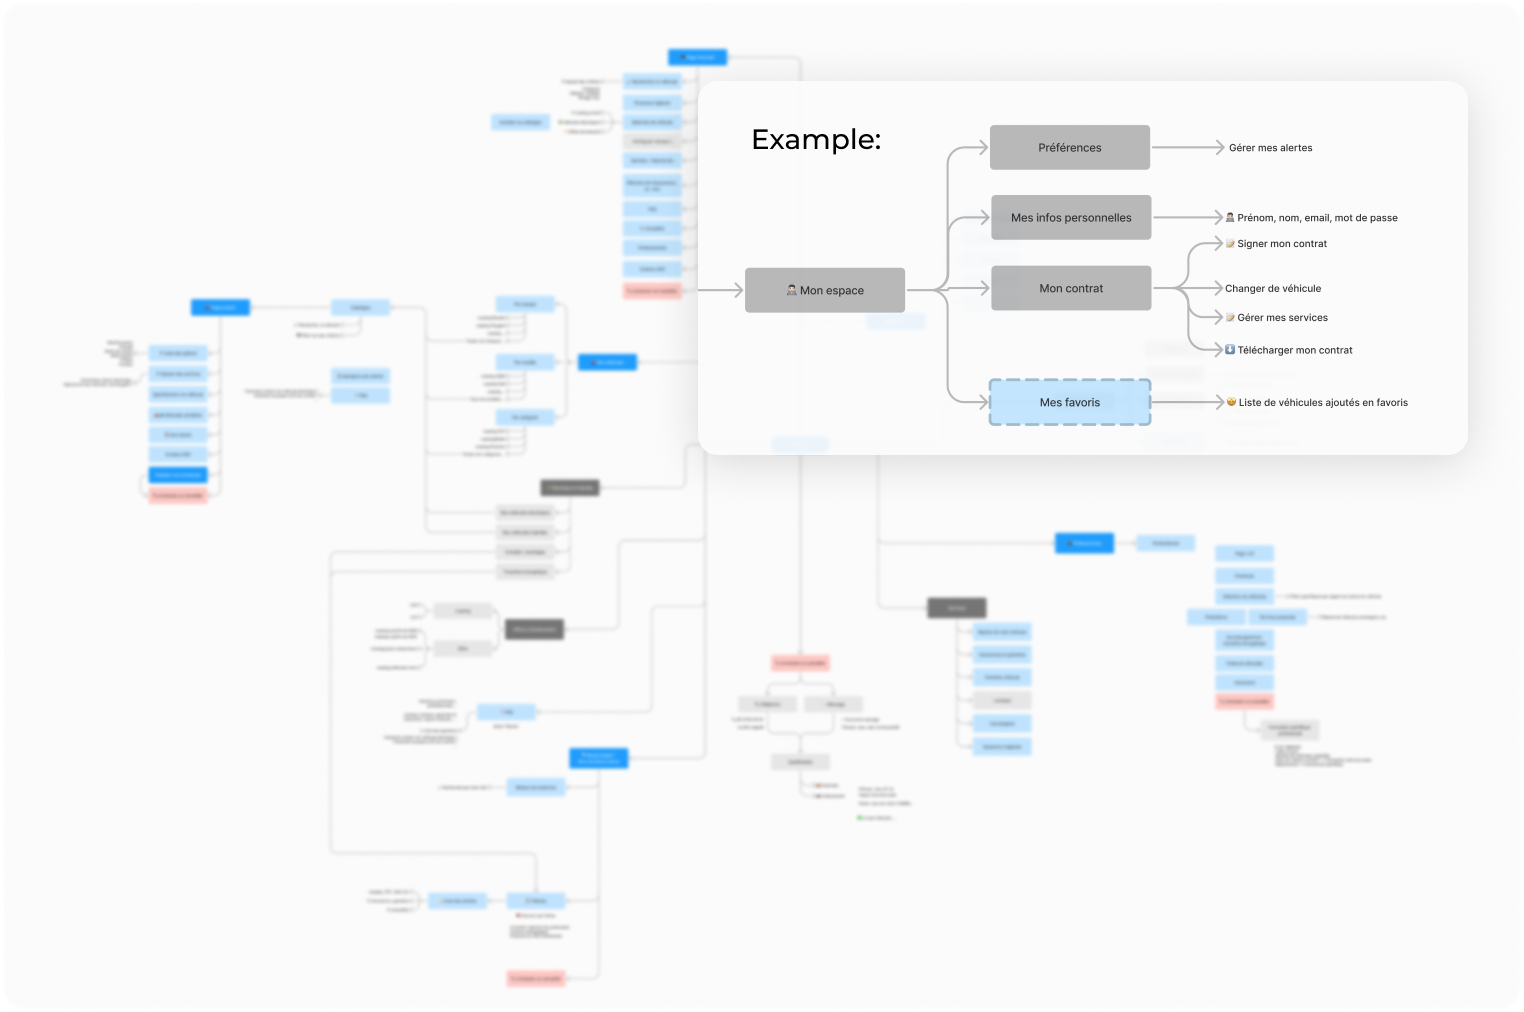
Site structure
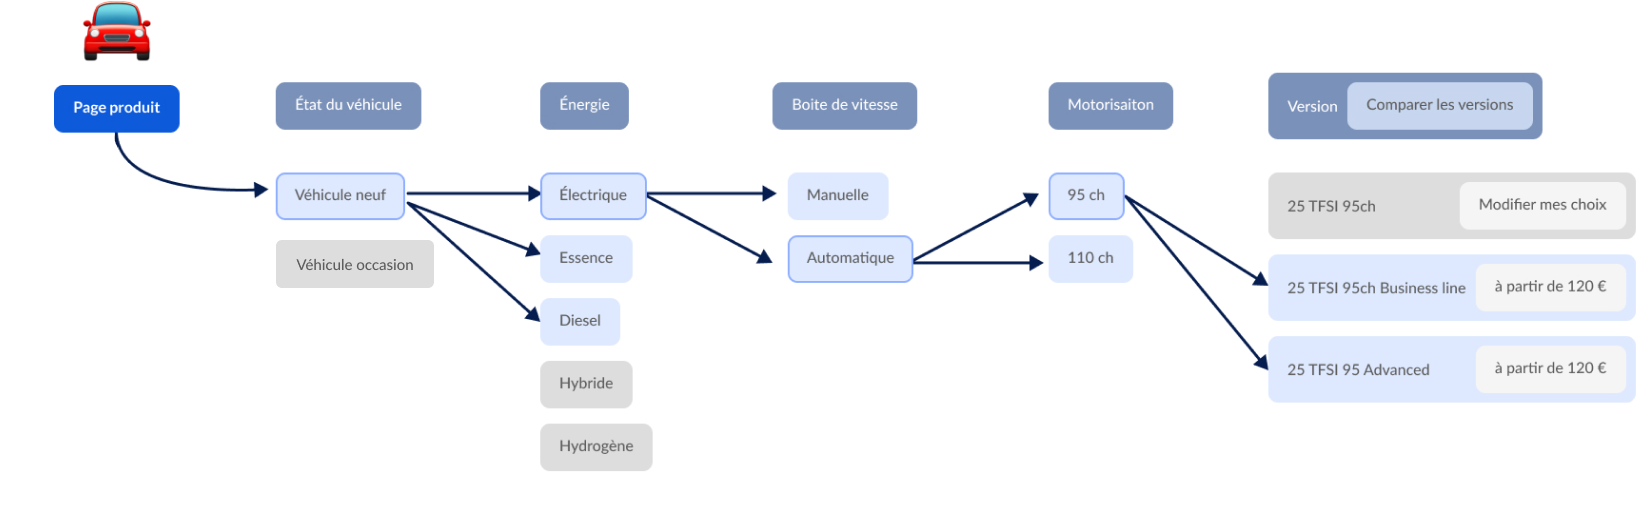
Found a car, then customize it.
Our new workflow permit to the user to first select a model and then decide what motorization he wants according to his budget, manual or automatic gear, etc. The vehicle model versions are displayed at the end of the customization.
Budget first
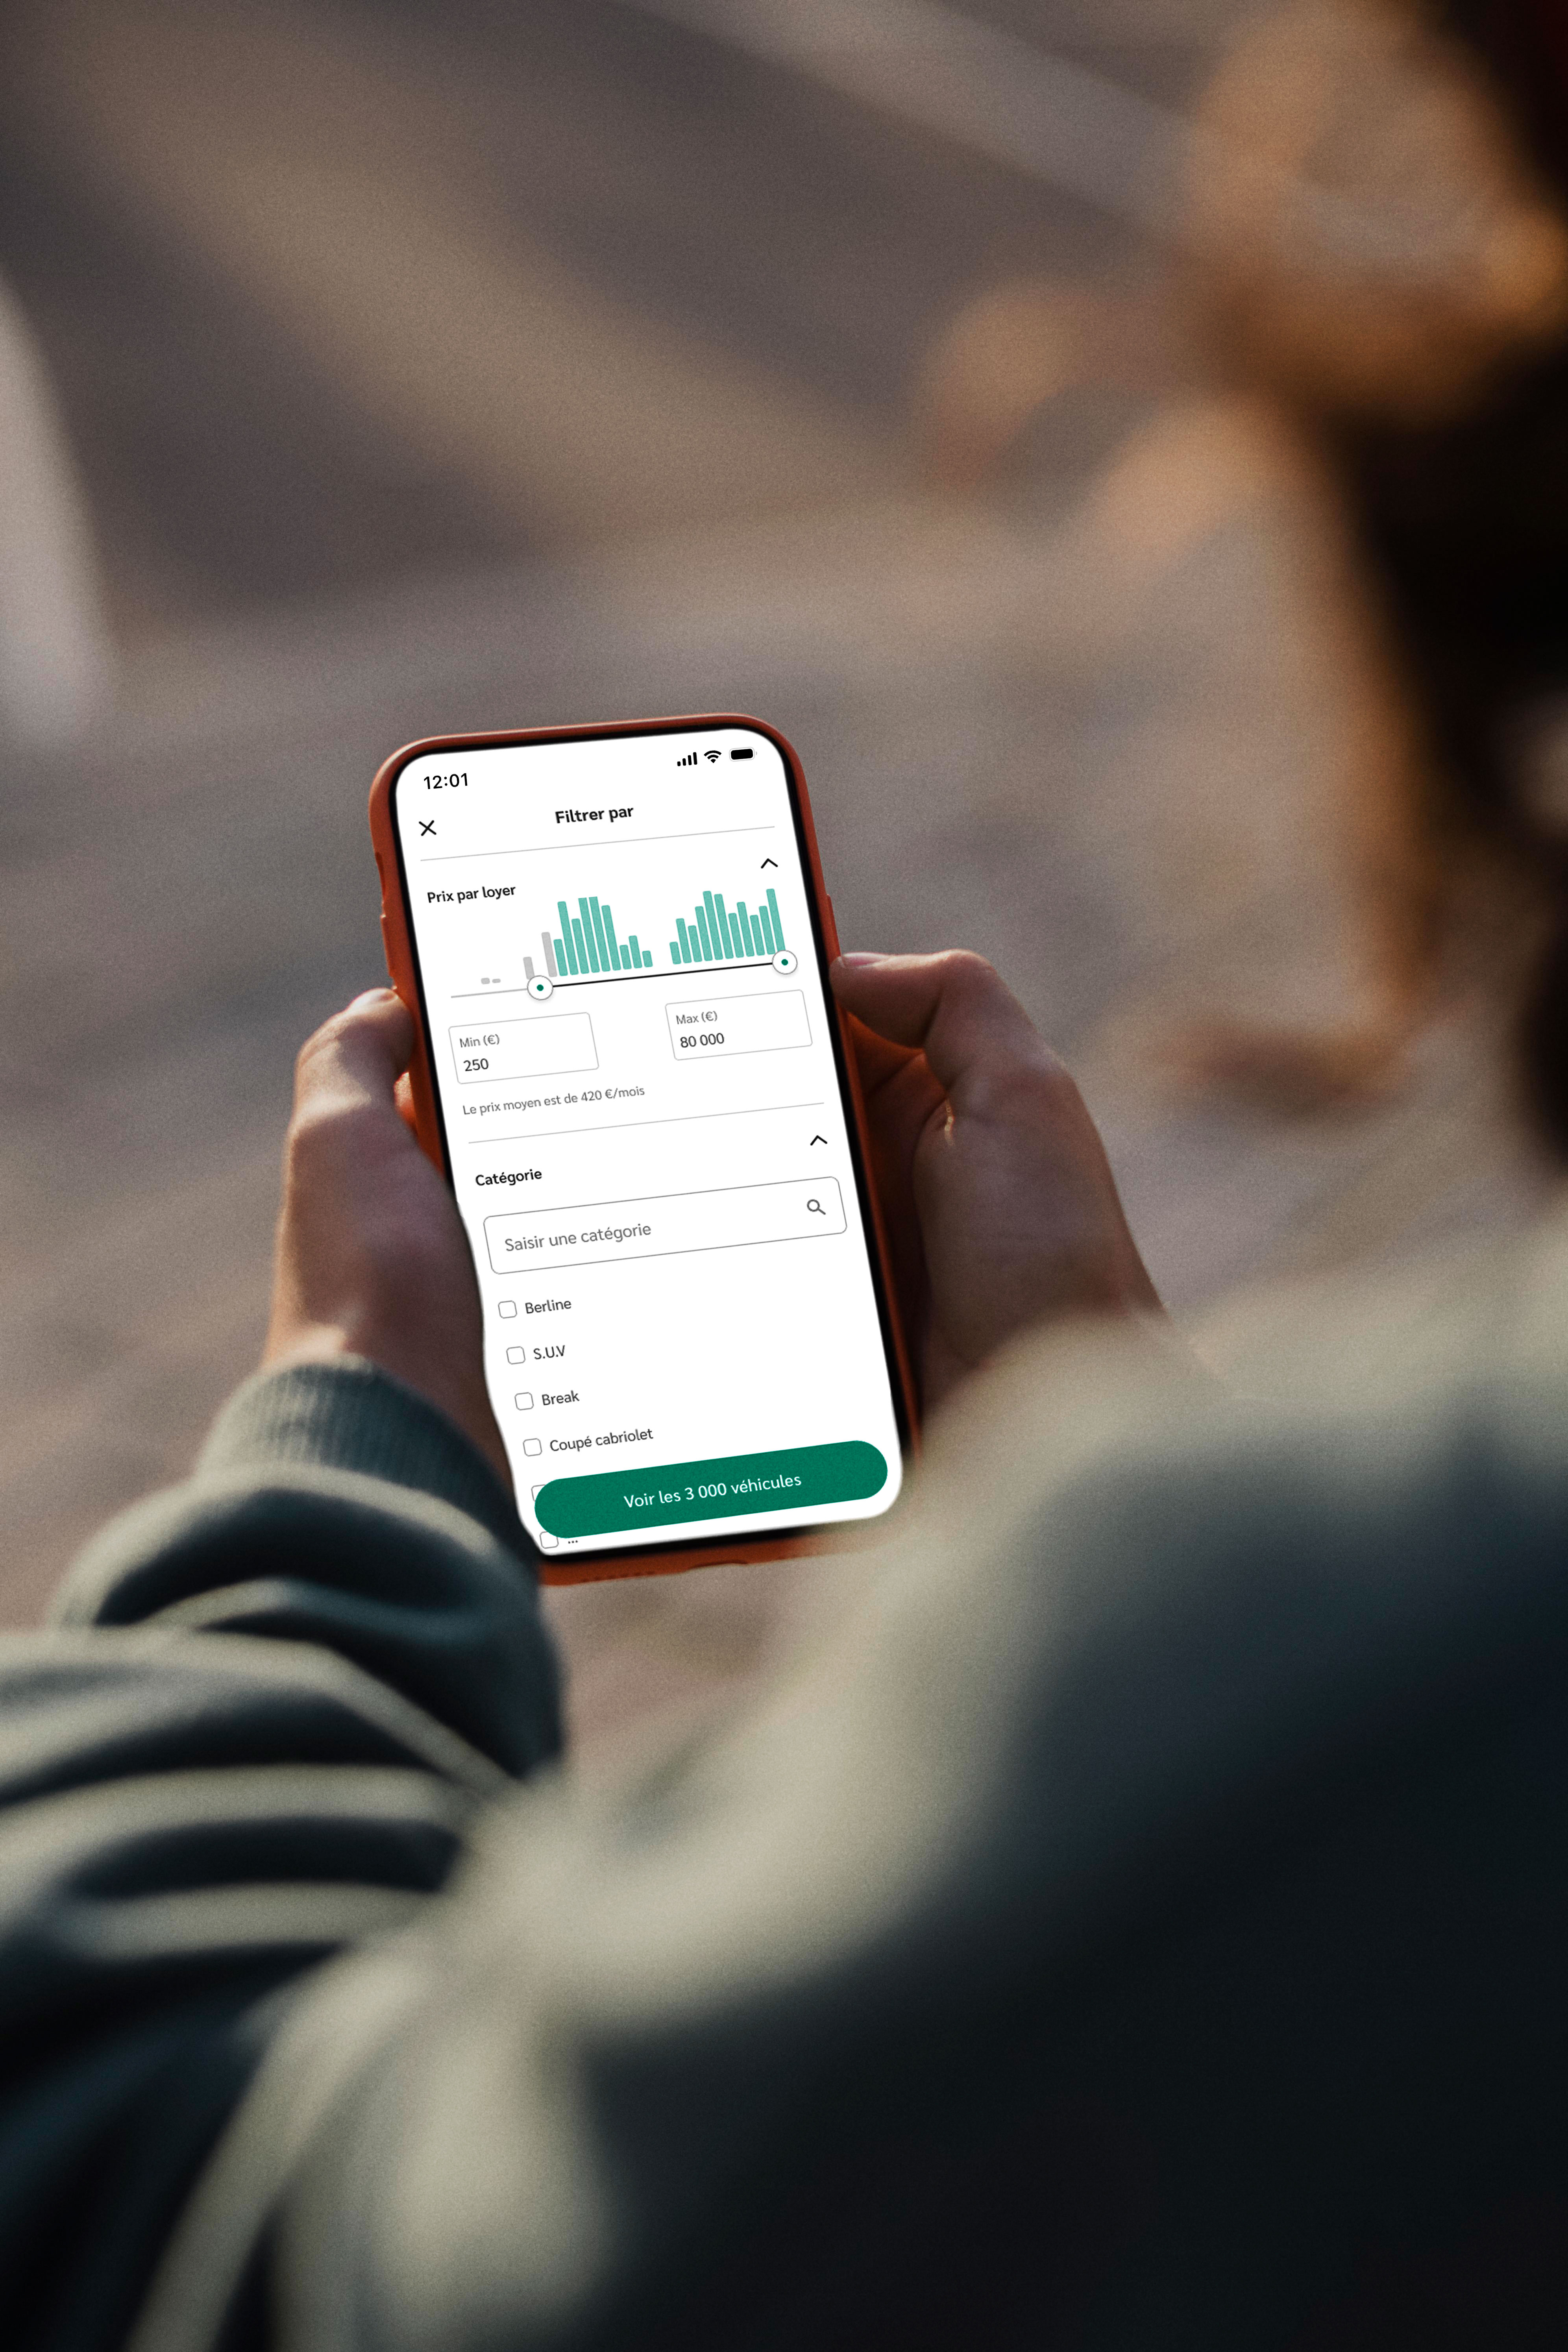
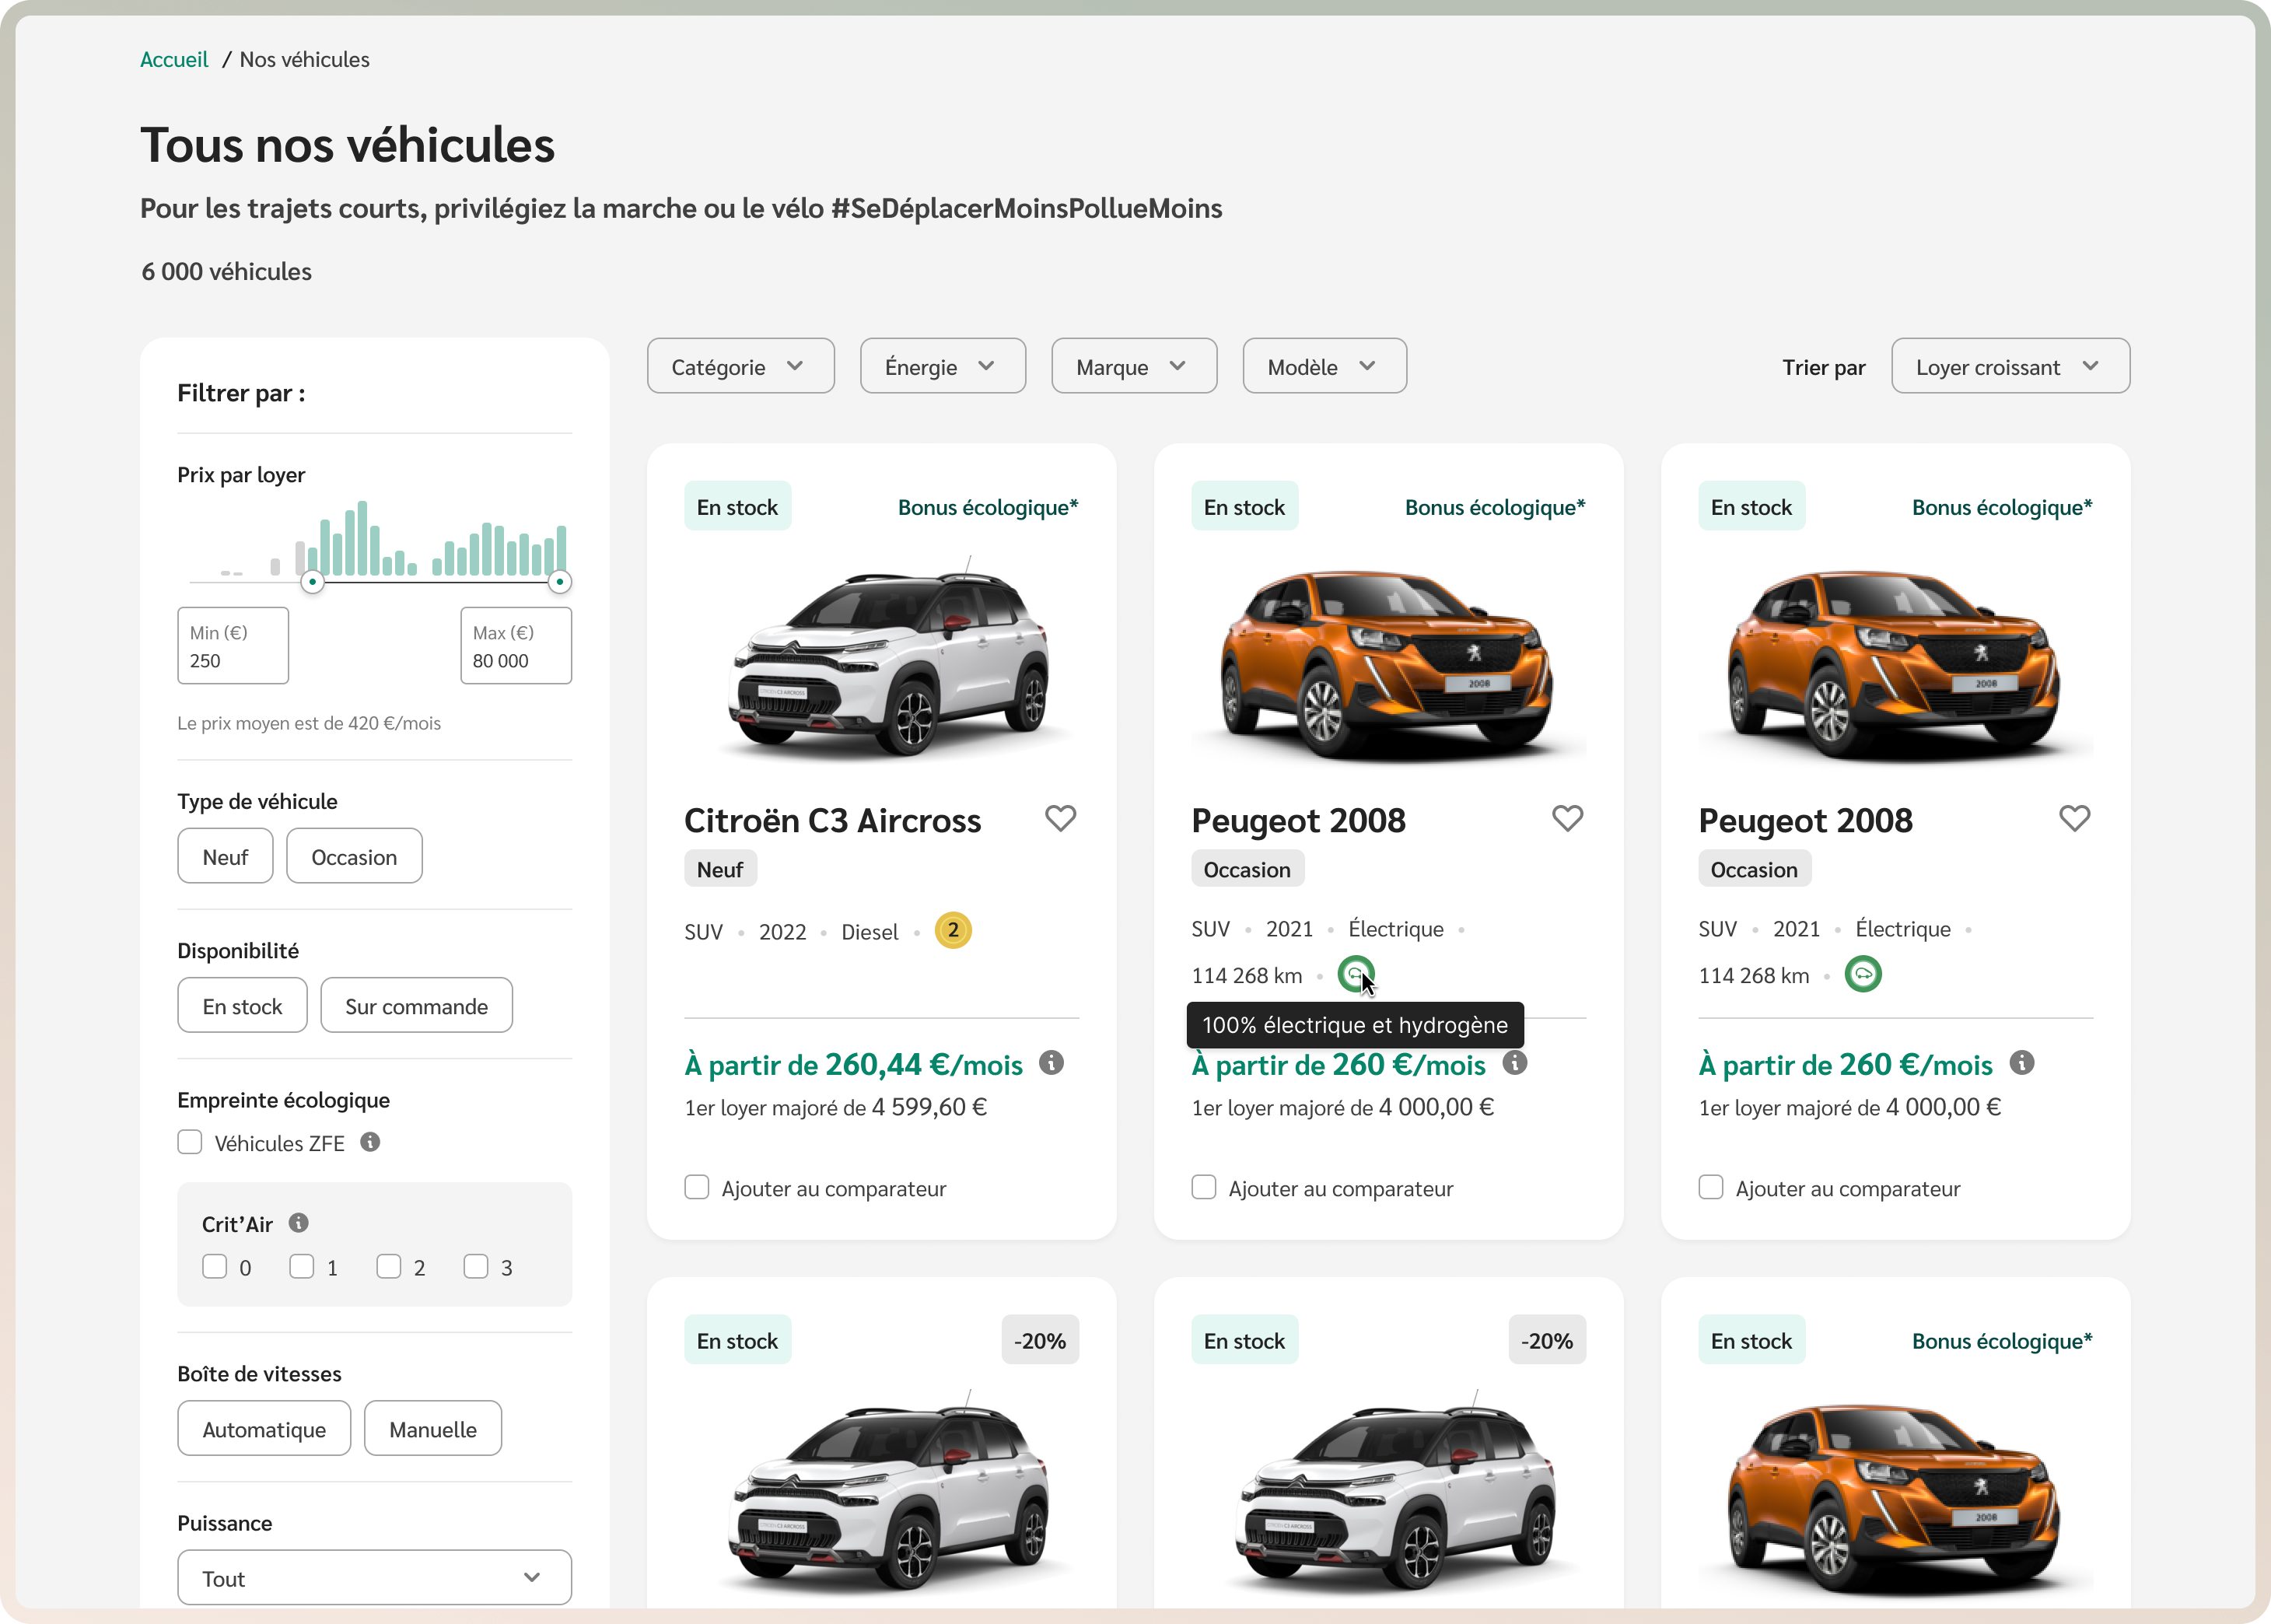
Budget was the most important criteria for users. This is why we decided to display the average budget for a car according to user's filters and the number of vehicles available based on the amount they entered.
Vehicle catalog
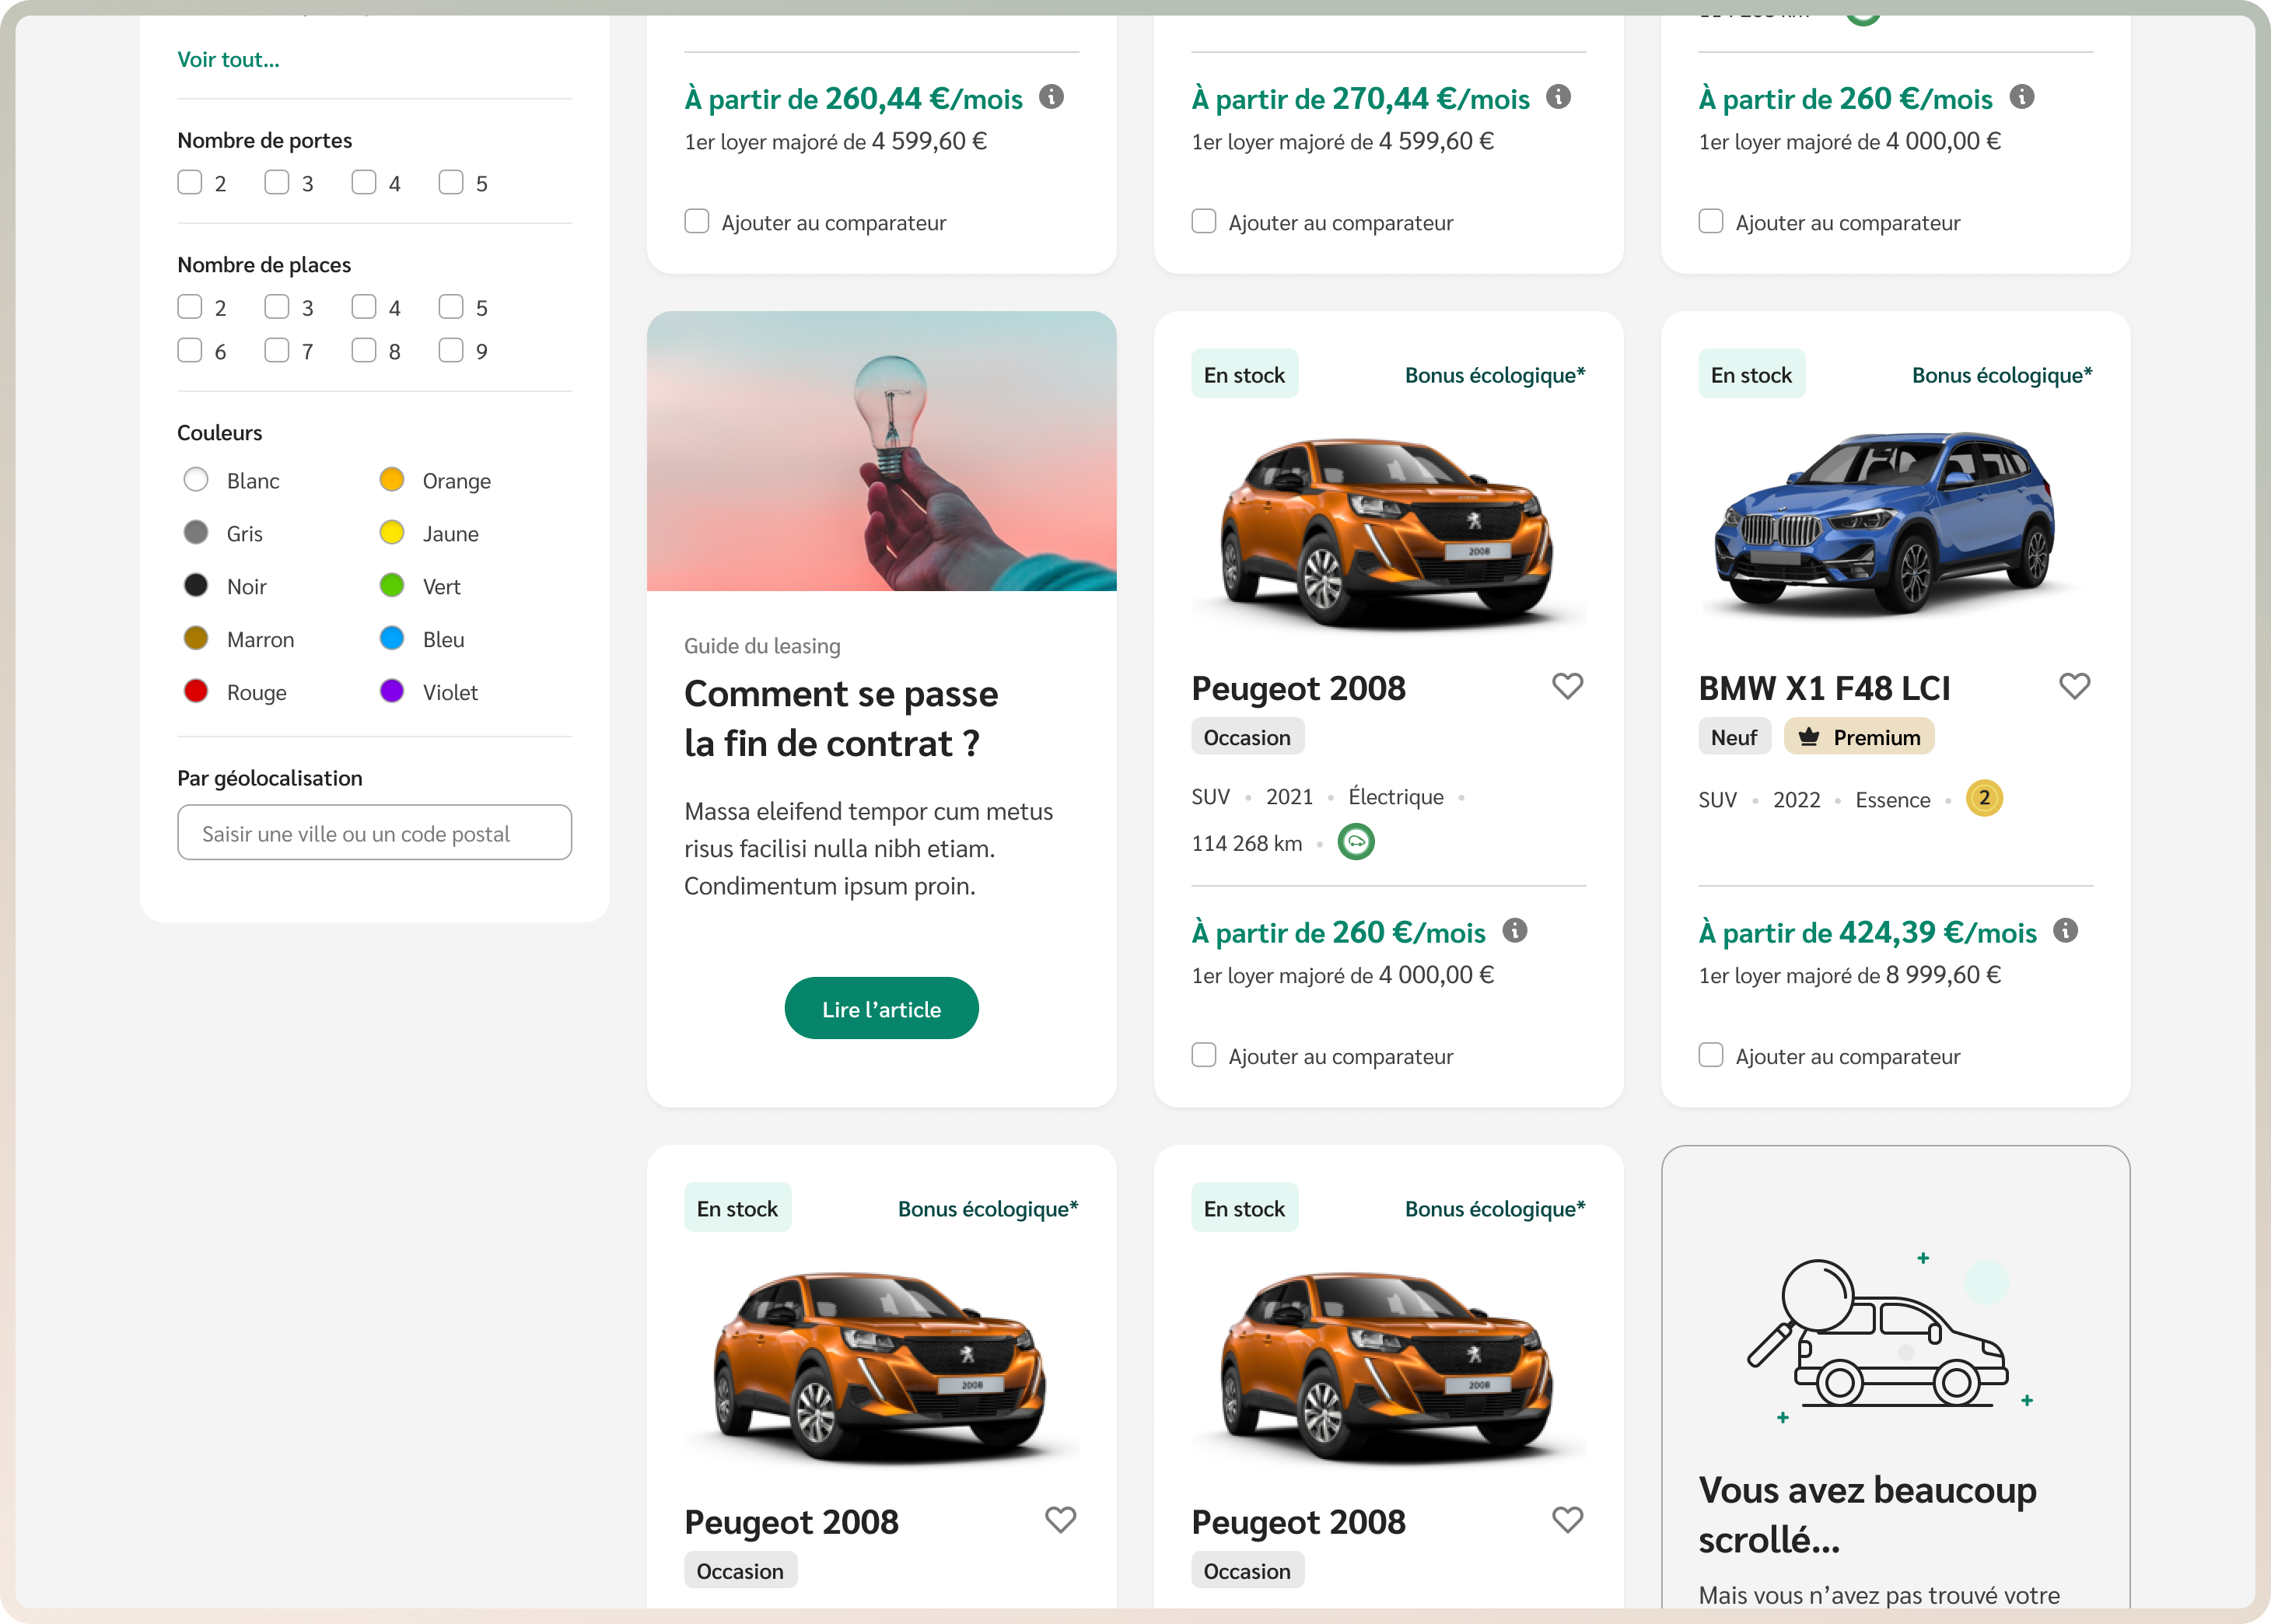
Reassure them
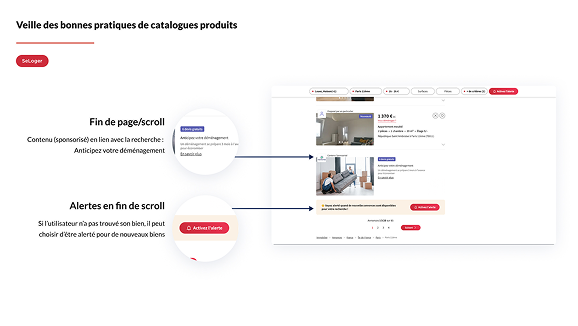
Thanks to the survey, we knew the end of the contract could be stressful. So, we've added reassuring content in the middle of the product catalogue and feedback from users at the bottom of the product catalog and product pages.
Vehicle catalog
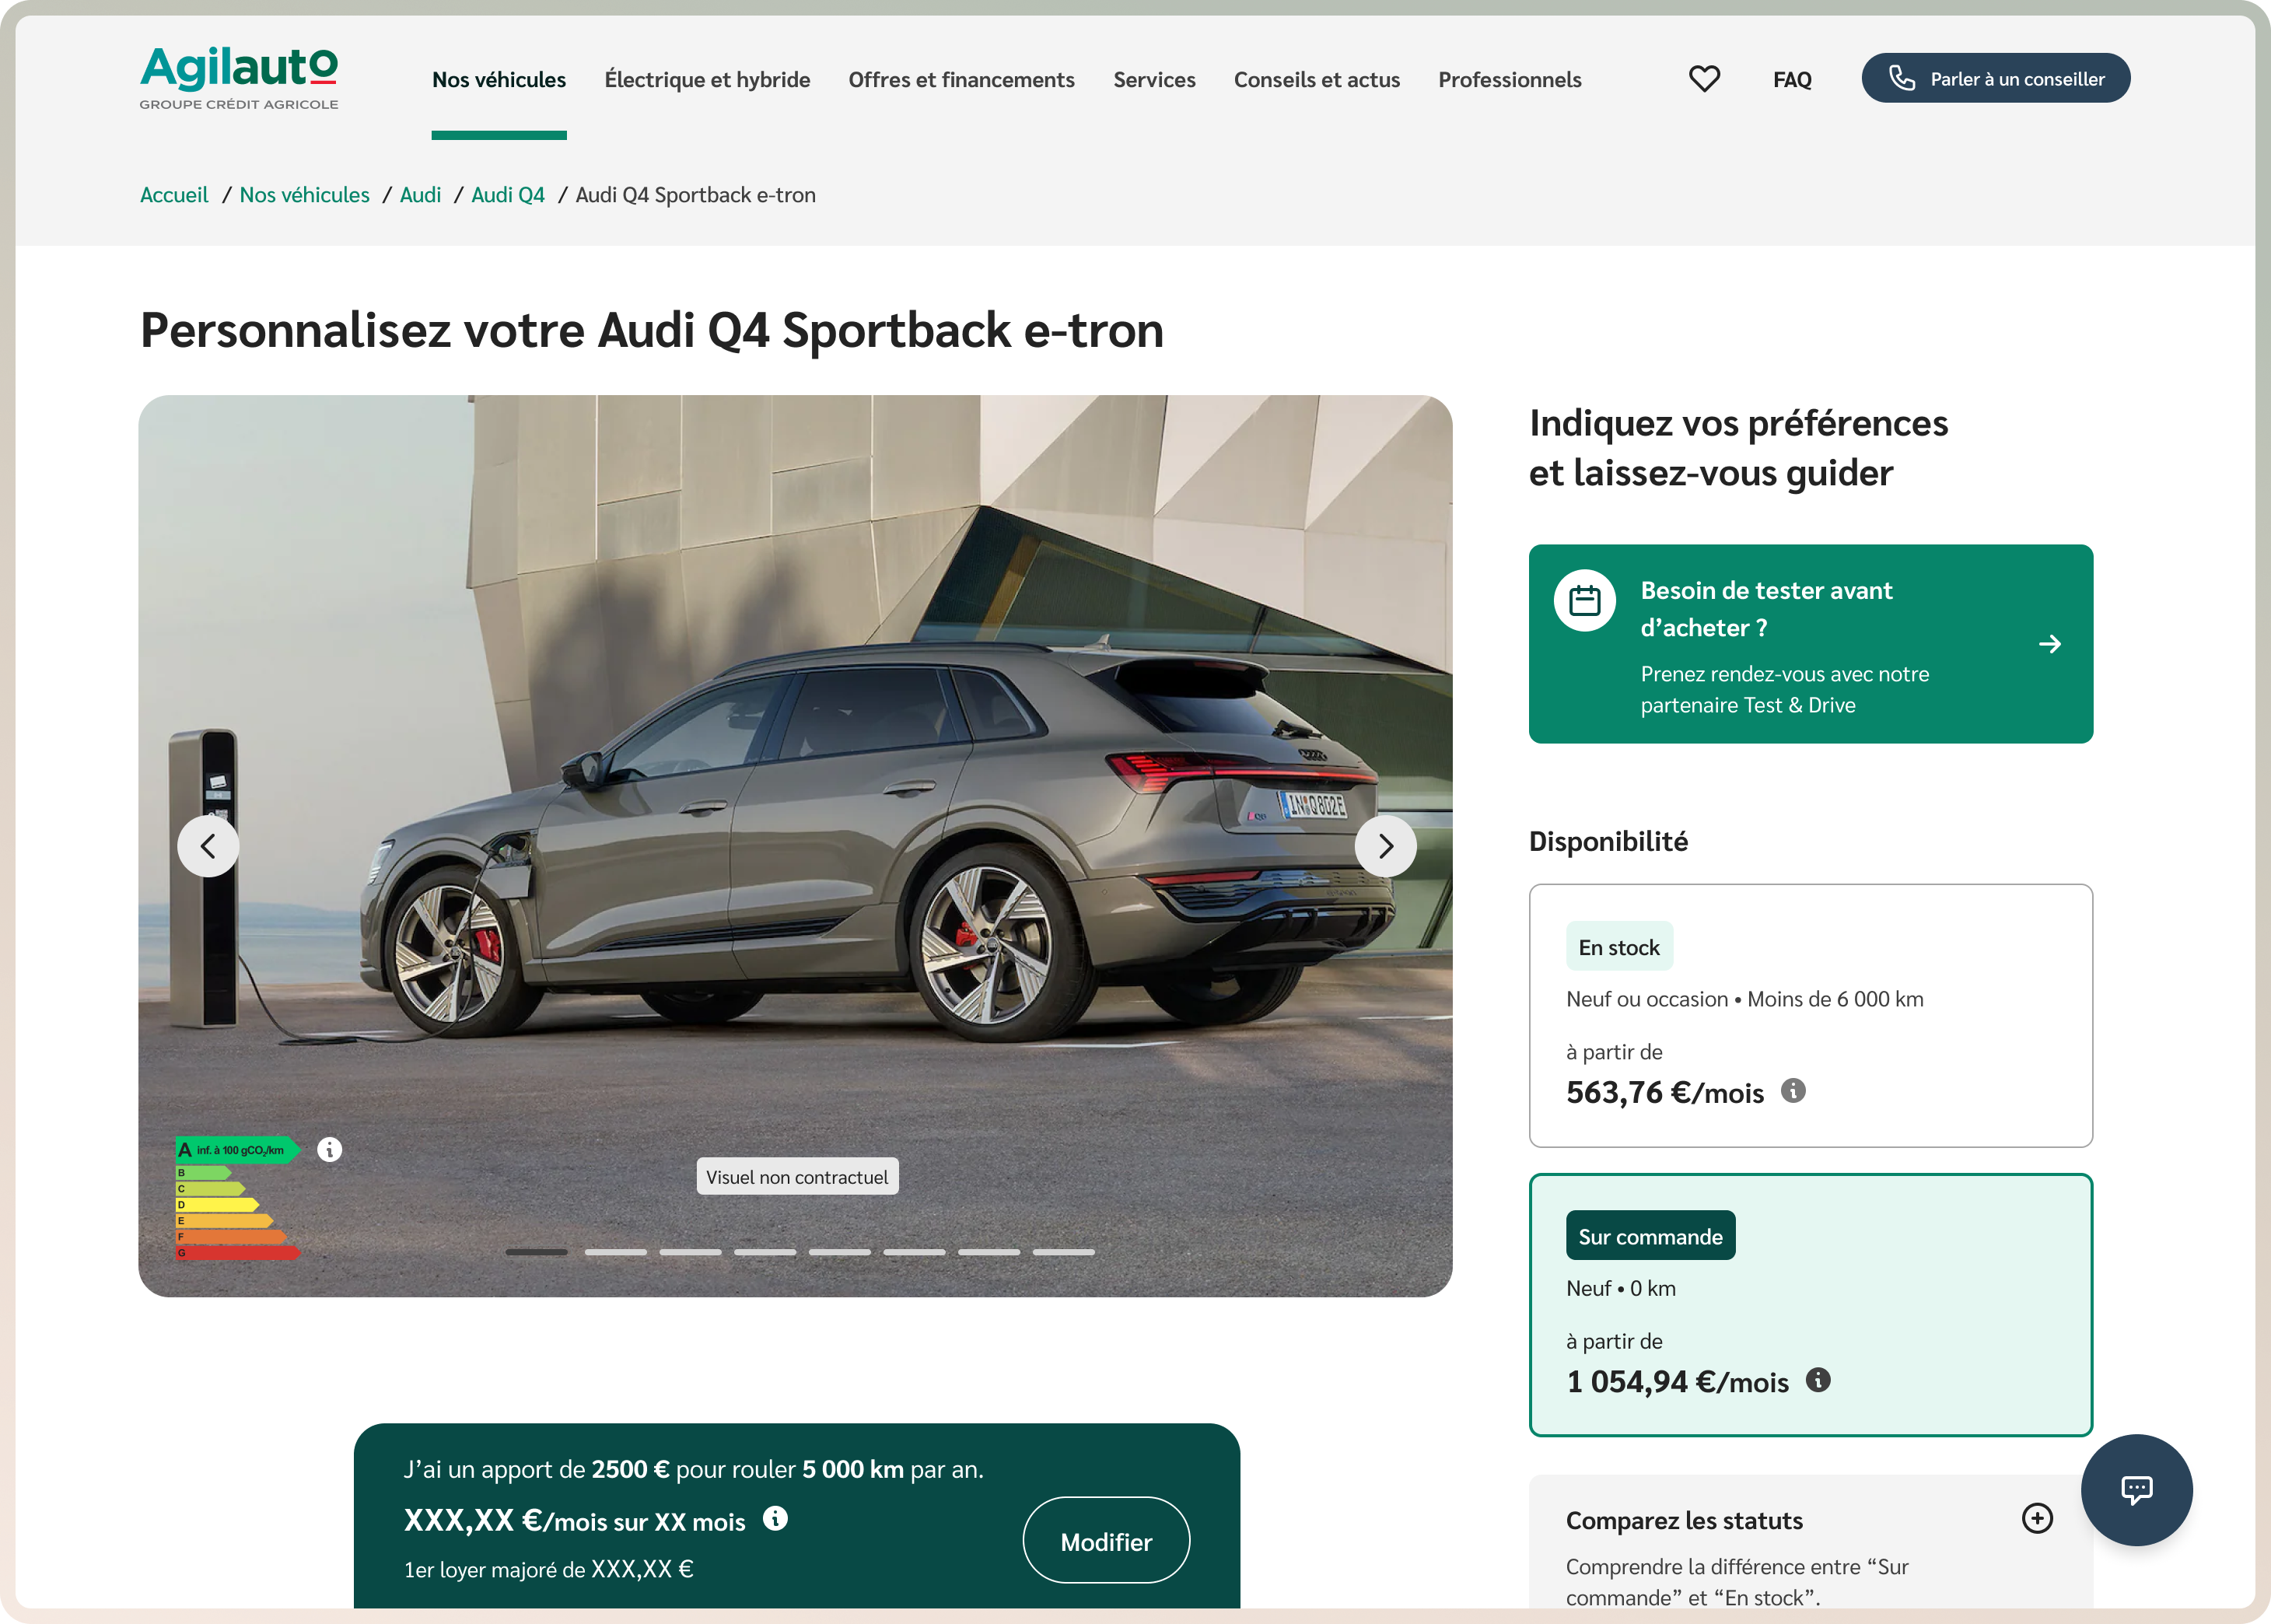
Customize your contract like your car
Users can enter their money contribution, contract duration, mileage per month, to get a better idea of the monthly rent. They can also add extra services like repair assistance, vehicle replacement.
Vehicle and contract customization
04
User tests
Test & learn
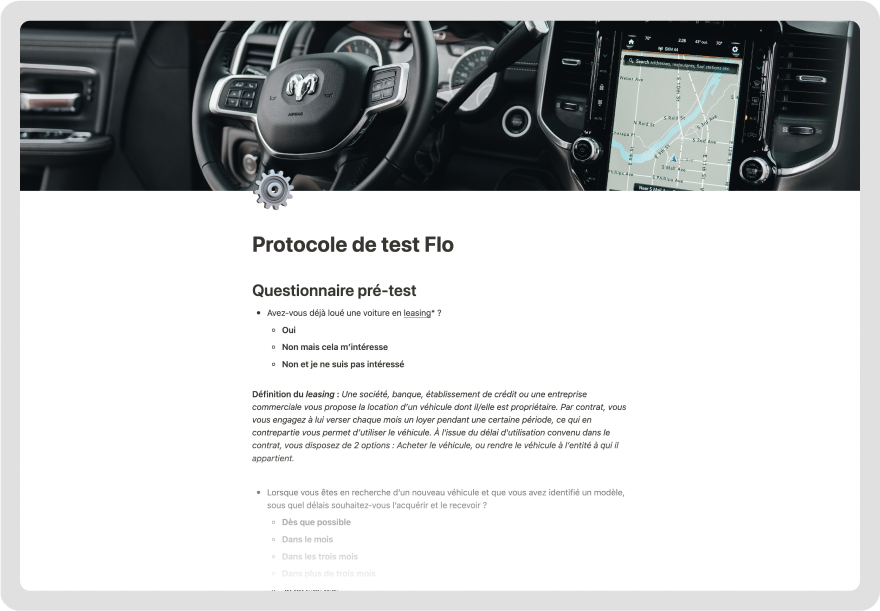
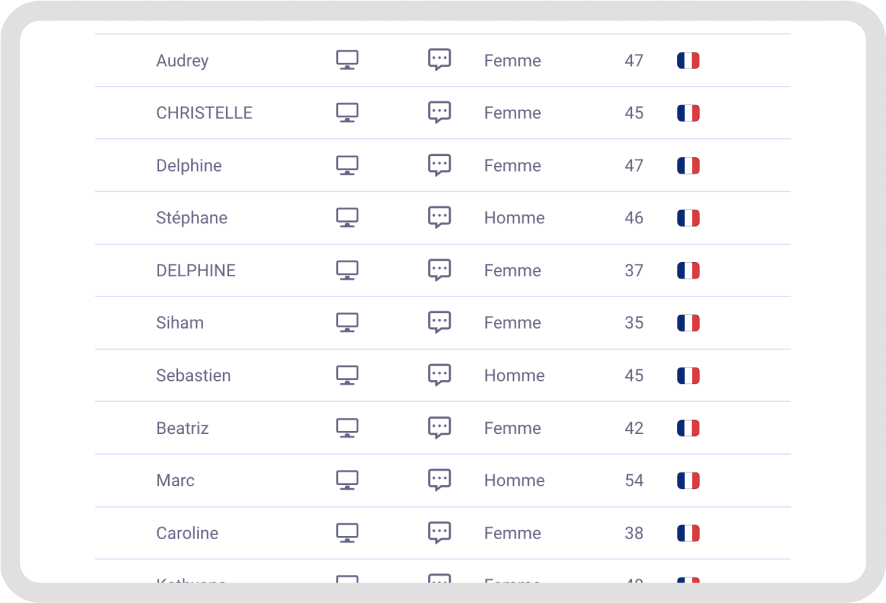
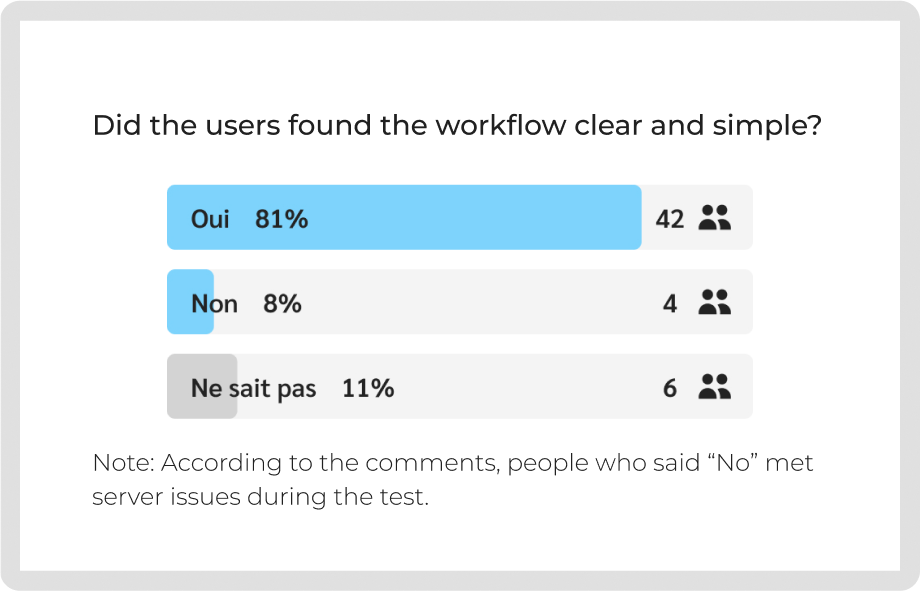
To get feedback we did one-to-one test with a protocol test. We also used Testapic, a website to conduct user tests with a defined panel, to get feedback from 52 people.
Quality test
Through individual testing, we were able to observe how users navigated the website, which allowed us to identify elements that were read but not understood. We found that certain services were misunderstood; consequently, we added specific questions for the quantitative test.
Quantitative test
We quantified the feedback thanks to a survey on our key users. Our panel criteria were:–Men and woman–Between 35 to 55 (with a majority around 42-45 years old)–Have a driver license–Have a car.
Feedback
Thanks to people feedback the full process was approved. We edited some wording where it was necessary and added more info texts and visuals. We got feedback about the missing prices for services, unfortunately our client was not able to display it.
Final
product
After 6 months it was online. We, as designers, were following the developments and testing every features to identify potential mistakes. Every week we were meeting with the product owner to prioritize bugs, mistakes and improvements together.
Accessibility criteria were followed during the design process and tested by us and experts like beplayerone. Every pages were made for desktop, tablet and smartphone to get a responsive design, and a design system was created for further release.